
How To - Intro to Dimensions Reporting
Dimensions is the powerful reporting module that is used for all report generation from the Aztec system. There are many functions included which allow creation of favourite reports, exporting and emailing reports and filters and lookups.
Finding Reports
Dimensions is launched from within the Aztec shell, and once open runs as a separate application (window).
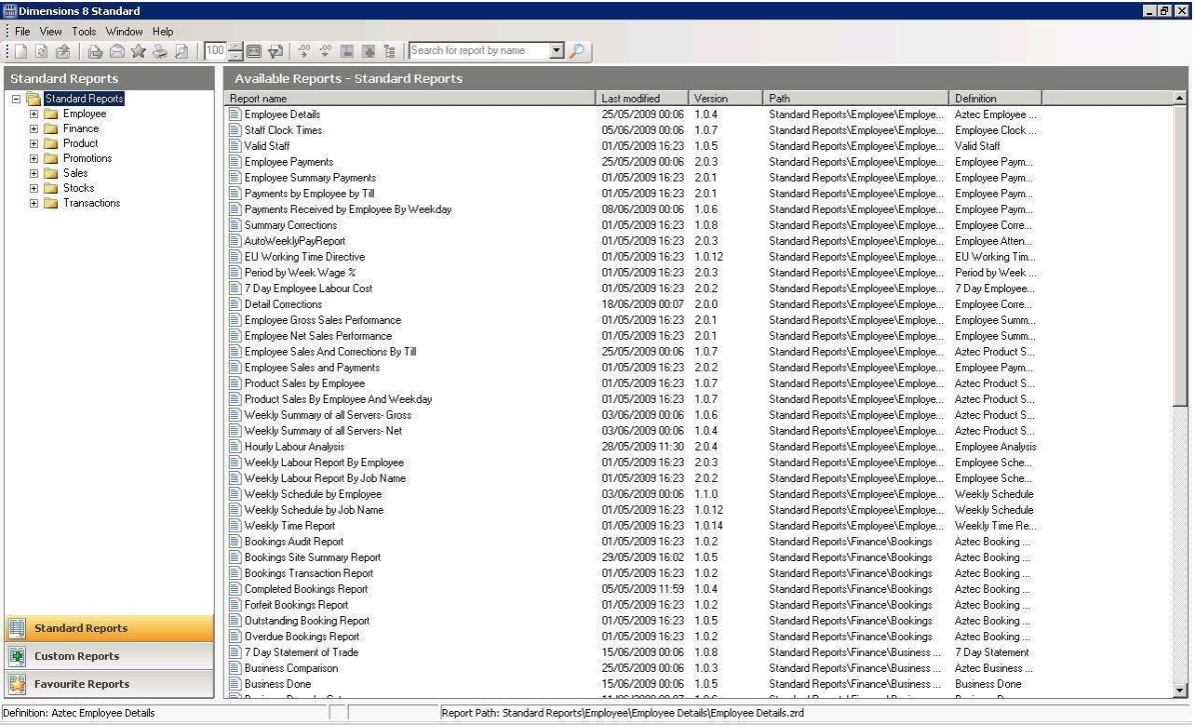
Standard reports are displayed on the screen and can be selected from the main body of the application or searched for using the search box at the top of the screen, alternatively from the menu tree on the left-hand side.
Custom reports are reports that are custom produced and are not part of the standard pack, for example the purchase period report used for weekly returns is a custom report.
Favourite reports are reports that you might want to save as a favourite for example something you use every day or a report with criteria / filters applied.
Once the required report has been selected, the report details screen appears, which presents a combination of different criteria:
| Section | Set to your site name |
| Layout | The report layout (some reports only have one layout). The layout refers to the tabs at the bottom of some reports which allow you to navigate between different sets of information. |
| Date Selection | Some reports have set date ranges (e.g. a week) but others can have many combinations of dates, day, week, period, year, no. of weeks. Quick date options are setup to assist fast navigation, for example to yesterday or last week. Many of the reports allow you to select multiple dates or weeks by holding the shift key down and block selecting using the keyboard arrows. |
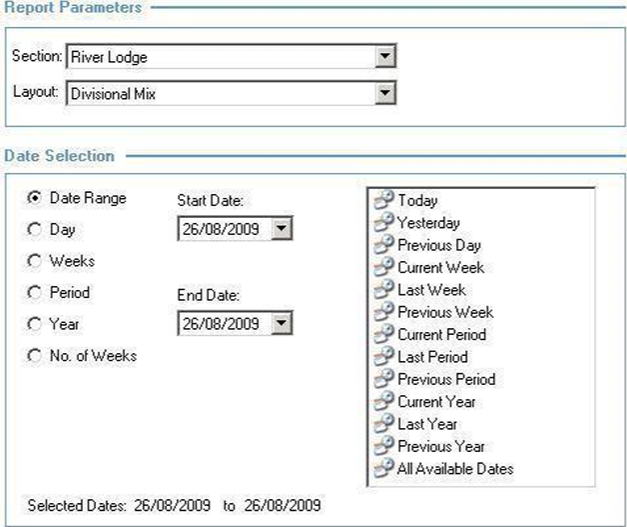
Once appropriate selections have been made, click the View Report button to generate the report.
When the report has been generated it will be displayed on the screen. To the left-hand side, the Dimensions bar allows you to apply different filters to the report.
The Dimensions bar uses the hierarchy structures which exist within Aztec and allow the user to quickly filter information in a report. For example, within the product drill Dimension if the “Wet” division was selected, you can drill into a specific area of the product structure tree to be able to report on only a particular section, for example, only 'bottled products'.
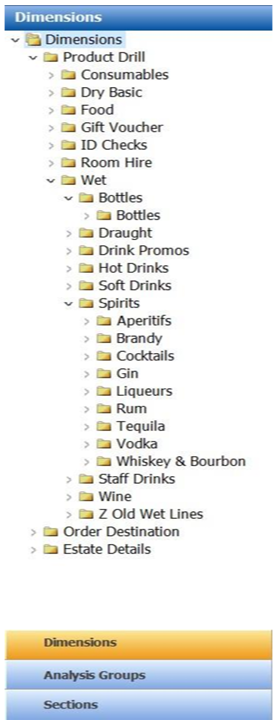
Depending on the report selected, particular dimensions are available, e.g., estate, product, or calendar filters.
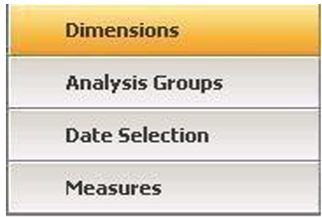
At the bottom of the Dimensions bar are additional options, which include:
-
Analysis Groups – options to add your own criteria in multiple formats
-
Date Selection – ability to change the date range of the report without having to re-run the report
-
Measures – options to change the report between quantities or gross / net sales
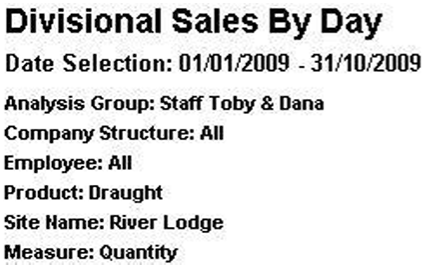
When the report is open, applied criteria will always be visible at the top the screen.
Analysis Groups & Filters
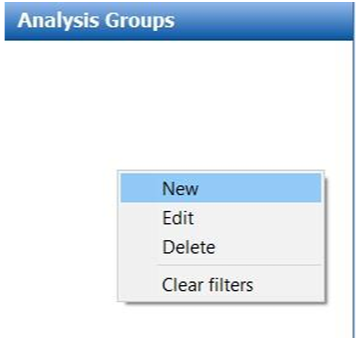
Analysis Groups allow the user to set bespoke filters using the hierarchy structures which exist within Aztec, allowing non-required information to be removed.
Once selected, right-click in the blank area below the Analysis Group header to add a new group.
Select the required filter criteria using the Dimensions hierarchy structure
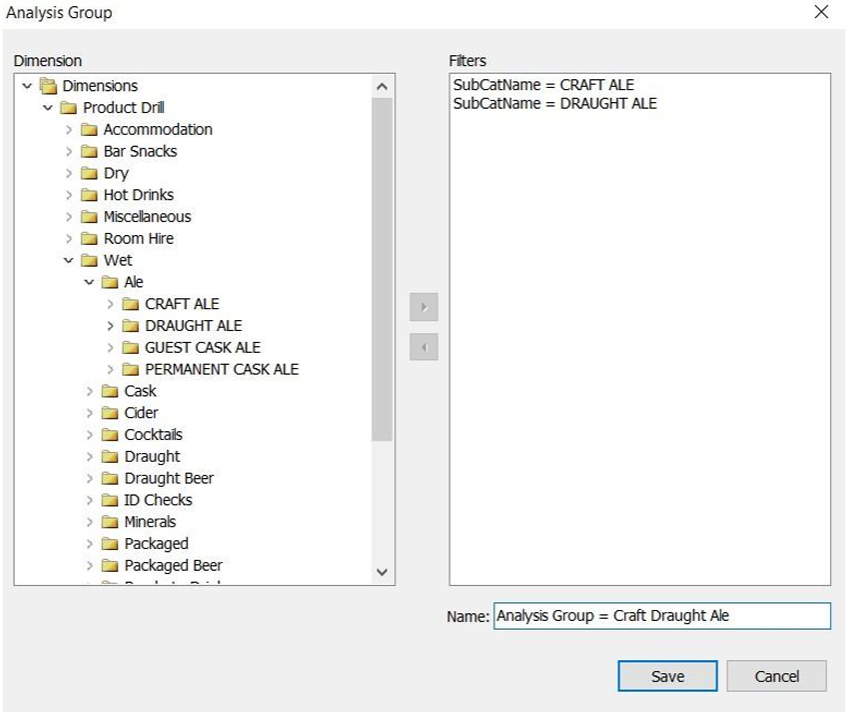
The analysis group filter will now be available to select from the list.
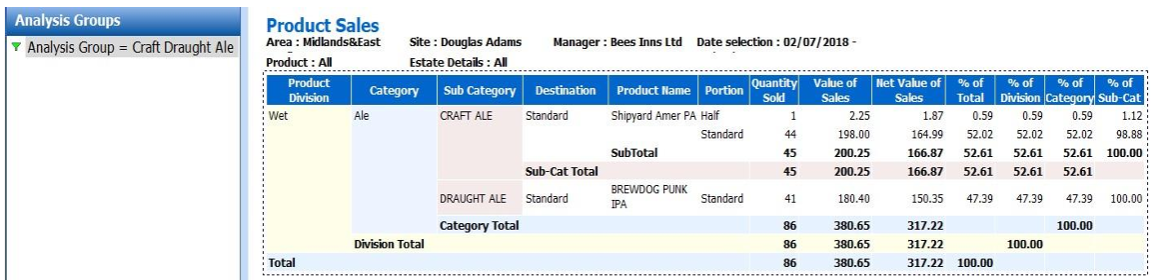
Analysis Groups can then be saved into a report using the favourites function explained below to either pre-filter the selected report or to allow the quick application of filters. Toolbar icons are displayed at the top of the window which can be used during reporting to perform the following actions:

|
Returns you to the main reporting window allowing you to select a new report (if used before closing a report, the open report will remain available in the ‘Window’ tab). |

|
Refreshes the report back to its original format. |

|
Closes the current report open on screen. |

|
Exports the report into either .html or .xls format. |

|
Emails the report as either an XLS attachment or embedded into the body of the email. |

|
Allows a report to be saved as a favourite for future use. |

|
Prints the current report (print preview of the current report is also available). |

|
Zooms the report in or out (a zoom menu set with pre-set zoom % options also exists to the right of this icon). |

|
Suppresses zero values in rows. |

|
Suppresses zero values in columns. |

|
Suppresses columns (additional options are made available to select once clicked). |

|
Hides or Shows the Dimensions bar (the navigation bar to the left side of the screen). |
There are other options available when a report has been generated, for example ‘lookup filtering’. Once the report has been opened right click a column and choose the “Lookup” option
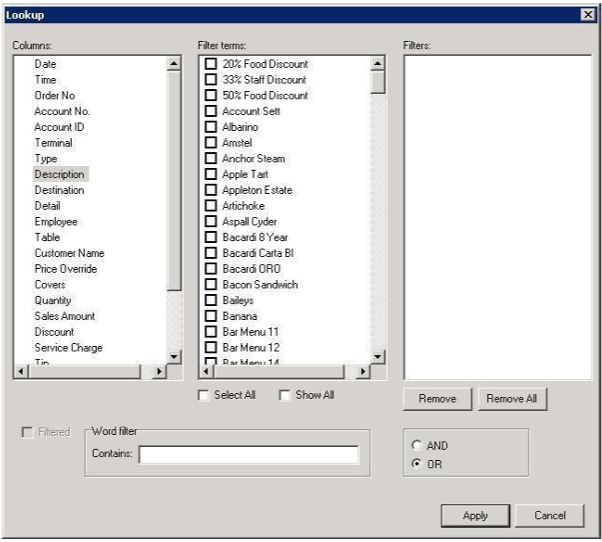
All the columns of the report are listed on the left, filters available for that column are in the middle, and then the filters currently applied are shown on the right.
Multiple filters can be applied, however when using filters from the same column the “or” option should be applied but if filtering from different columns the “and” option should be used.
When the required filters have been set, press the Apply button and the report will be re-generated.
By right-clicking on the report the lookup screen is displayed once again and amendments to the filters can be made.
If you wish to remove all filters click the refresh report icon at the top of the screen and the original report will be displayed.
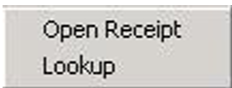
When navigating through reports, the mouse pointer icon can change to a cross - this indicates within that column that there are alternative options available. In this example there is an “open receipt” function which allows you to view a full receipt for the selected transaction, though in some reports you will also find options to drill through to a different report containing additional information relevant to the column you have clicked in to.
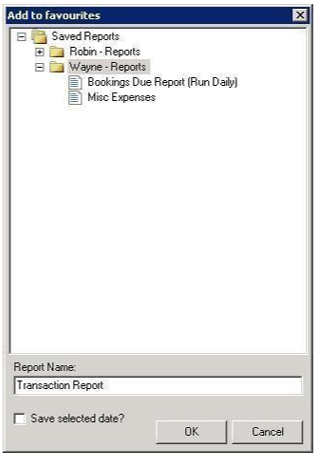
When a particular report is used regularly on a daily or weekly basis, the favourites function allows them to be saved into the favourites section on the front page of the Dimensions module.
This is a useful feature as it can save time in locating reports, or if a range of criteria needs to be applied, for example analysis groups.
When the report has been generated, click the favourite symbol (the star) and then the Add to Favourites window appears. Individual folders can also be setup if required by right-clicking on the Saved Reports section and adding a new folder. The report can also be given a unique name as required by the user creating it.
It is important to note that the reports you create will only be shown under your own login to Aztec. If different users require access to a report that you have favourited, then each user is required to separately generate and then save that report.